Chart of the Week
In 2025, the political acronym for the year was TACO (Trump Always Chickens Out)—a reminder of how often major policy initiatives struggled to reach completion. As we turn toward 2026, a new acronym...
Chart of the Week
In the latest edition of NDR’s Integrated Analyst, the Custom Research Solutions (CRS) team demonstrates a few of the many ways CRS customizes NDR’s asset allocation models to directly address client...
Chart of the Week
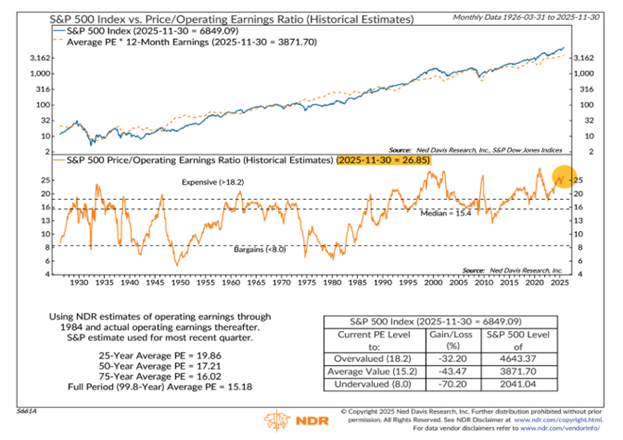
Valuations keep climbing, with several measures hitting new highs (chart above). By late November, the S&P 500 was only 0.6% below its October record, and its P/E based on total earnings reached...
Chart of the Week
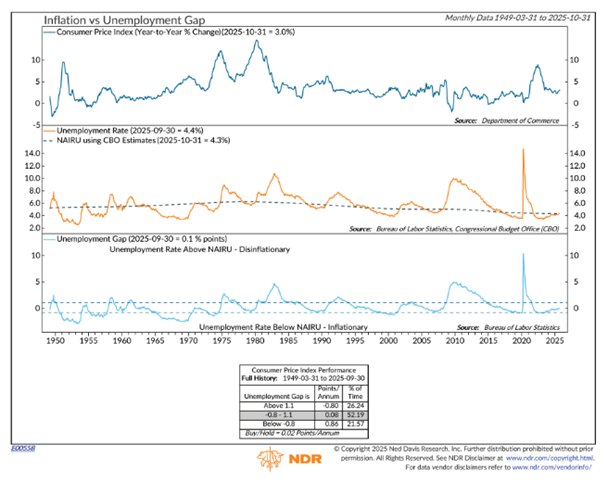
A widening unemployment gap is typically disinflationary. While tariff passthrough may add some upward pressure on prices, the recent slowdown in job growth and rise in unemployment to 4.4% suggest...
Chart of the Week
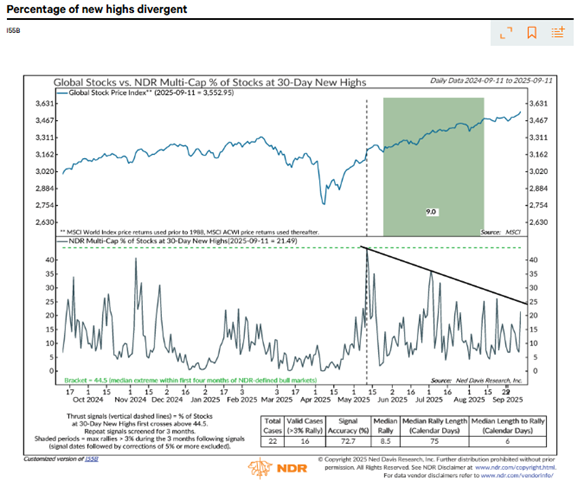
Major benchmarks have been hitting records thanks to market-cap heavyweights like Nvidia, Oracle, and other tech giants, but most stocks remain well below their highs. Of the 1,300+ stocks in the...
Chart of the Week
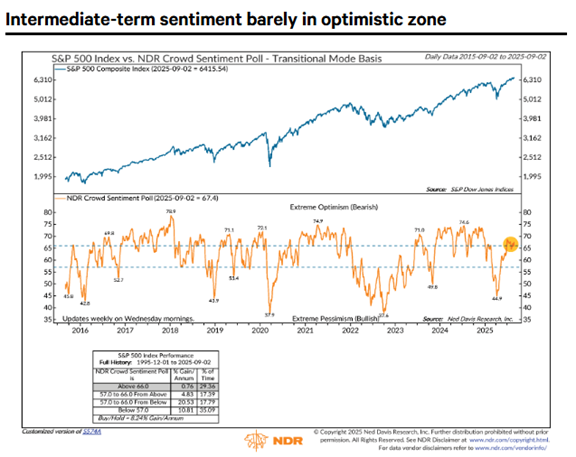
After tariff-driven pessimism in early April, sentiment rebounded with the market. The NDR Daily Trading Sentiment Composite jumped from 4.4 on April 8 to excessive optimism by May 14. Still,...
Chart of the Week
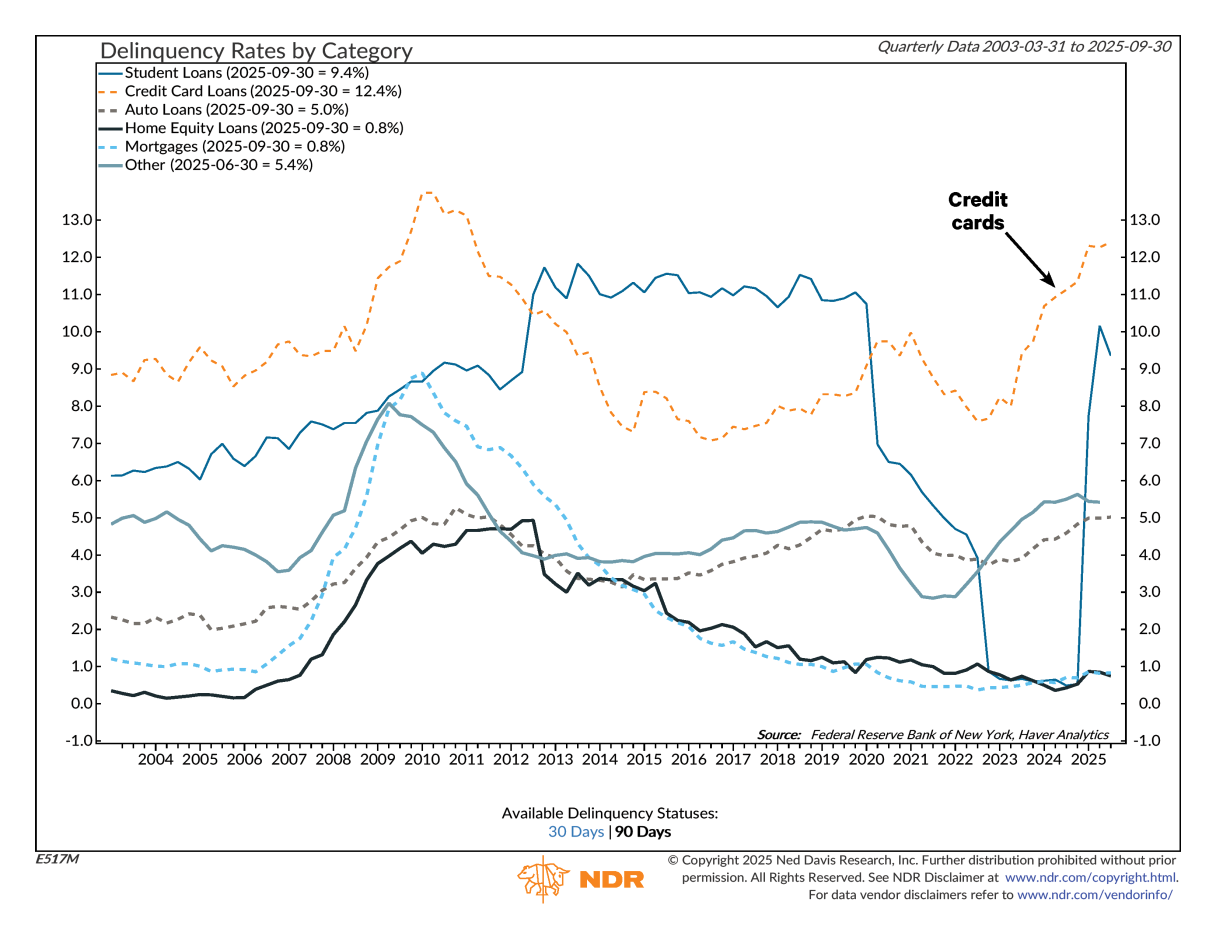
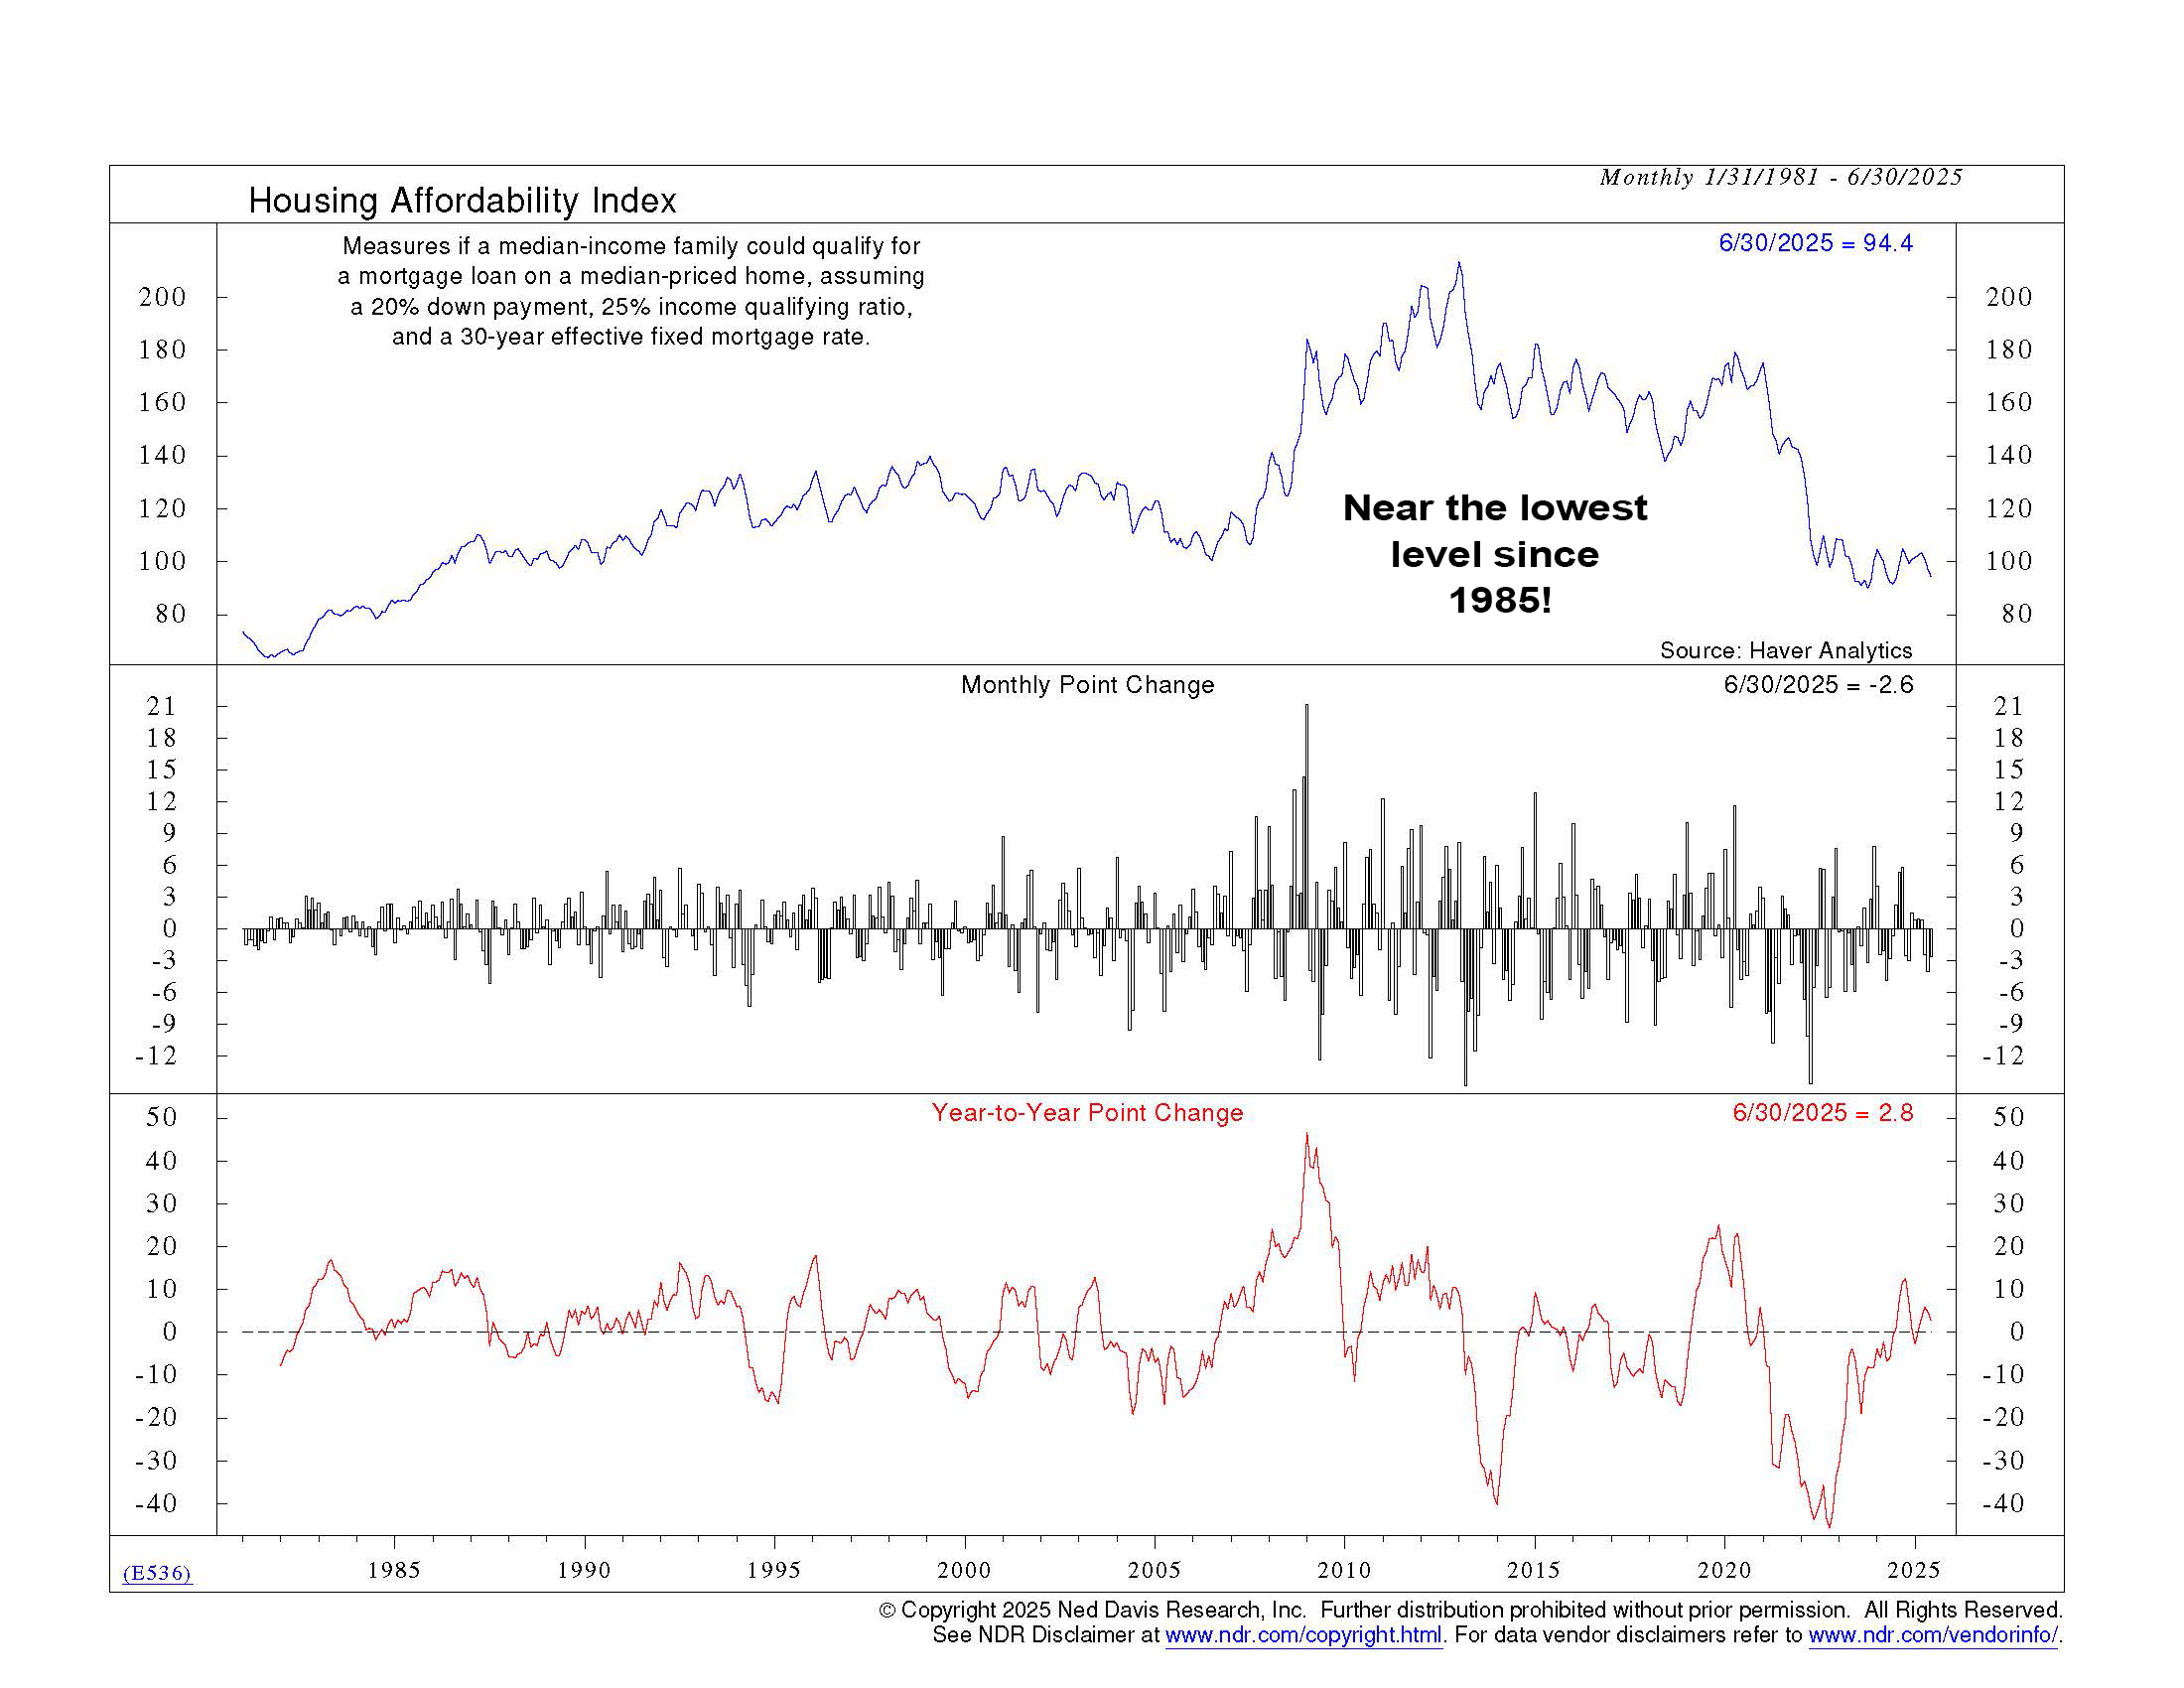
Housing has been one of the weakest parts of the economy under tight monetary policy, contracting in seven of eight quarters from mid-2021 through early 2023 and resuming its drag in four of the past...
Chart of the Week
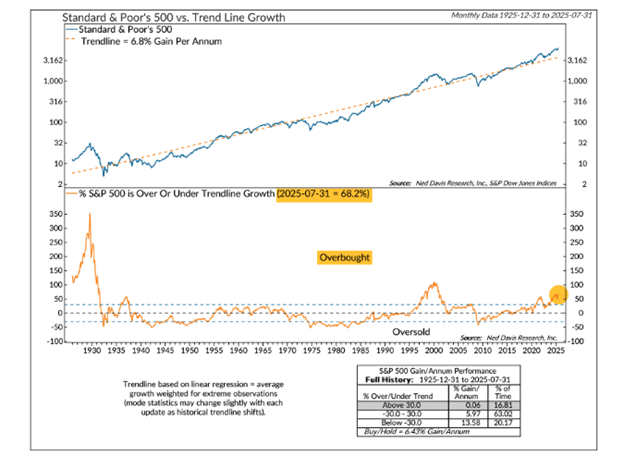
Most long-term stock trend charts suggest equities are overvalued, though total return measures paint a less extreme picture. Housing and the U.S. Dollar also appear overvalued, while gold is nearing...
Chart of the Week
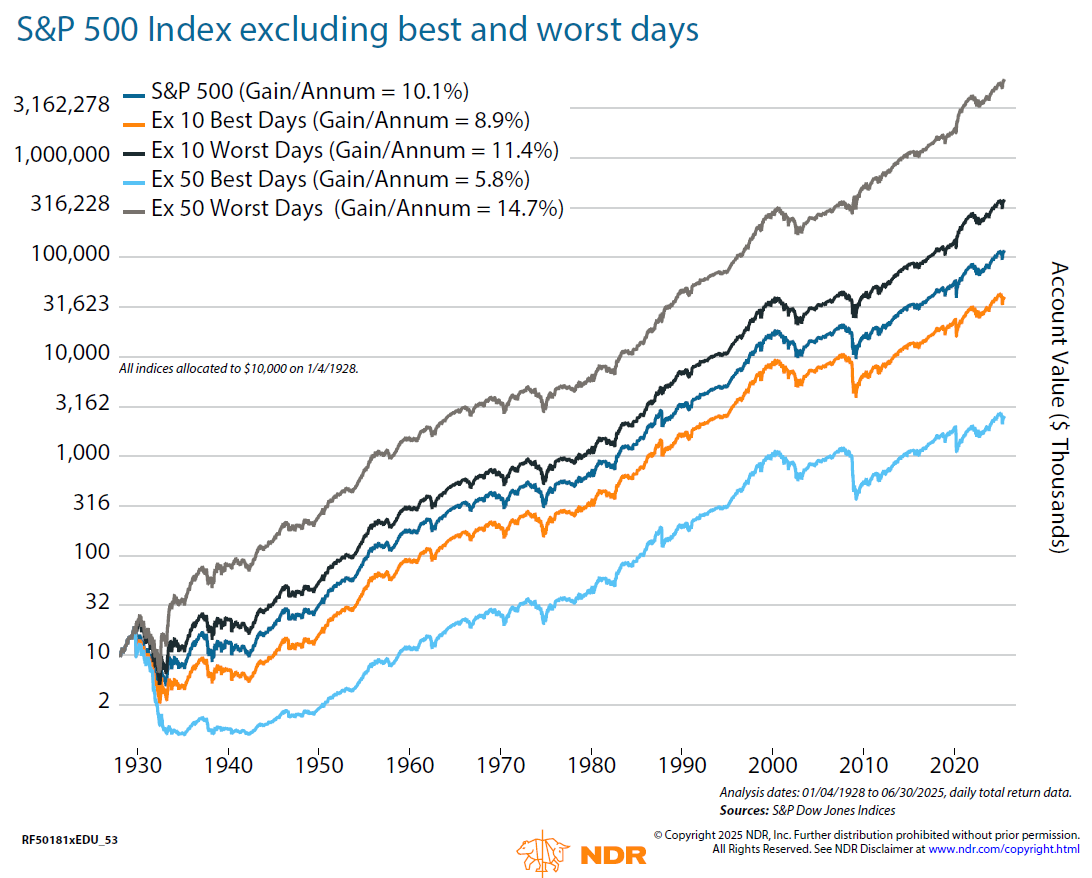
In the latest edition of NDR’s Integrated Analyst, the Custom Research Solutions (CRS) team takes a critical look at one of the most cited arguments against market timing: the idea that missing just...
Chart of the Week
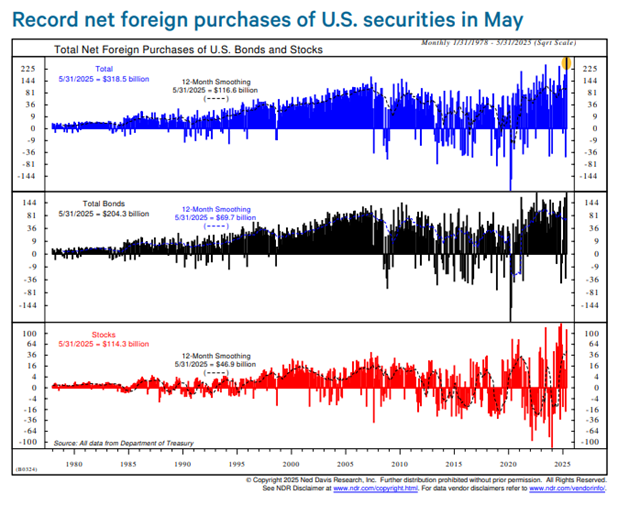
After stepping back in April, foreign investors returned to U.S. markets in force in May, with net purchases of long-term U.S. securities hitting a record $318.5 billion (chart above). Bond buying...