
Chart of the Week
NDR: Reversing from an oversold extreme
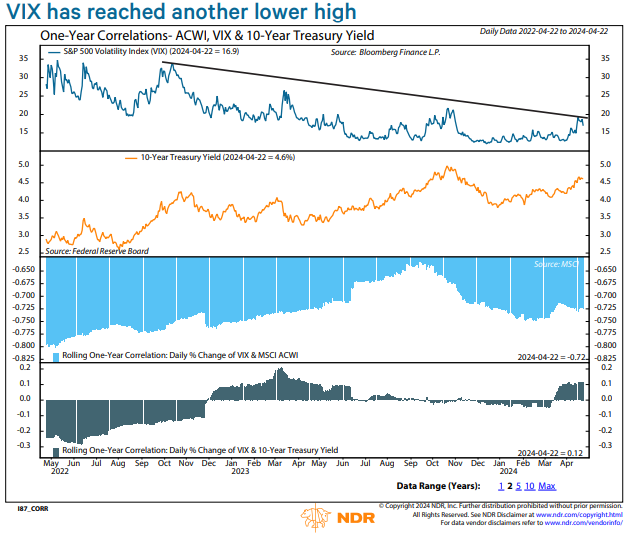
As market volatility tends to rise when equities are declining and to fall when the market is rallying, it makes sense that this implied volatility gauge has maintained an inverse correlation with the ACWI, over the last two years shown in the chart and over the entire period since 1990.
NDR's Chief US Strategist Ed Cissold noted in a pub from April 3rd, the signal moved significantly above the band marketing over optimism among market participants. While not wholly indicative on a stand alone basis, this is a core factor we monitor to indicate a risk of a downward reversal in S&P trading.
What has shown less consistency is the correlation between the VIX and the 10-year Treasury yield, which has been turning positive. The April weakness was driven by rising bond yields and accompanied by a rising VIX.
Compelling, right? Fill out the form to the right to request access to a complimentary trial of the NDR platform that includes our full suite of research predictors and indicators to stay ahead of market trends. NDR can help you See the Signals.™