Chart of the Week
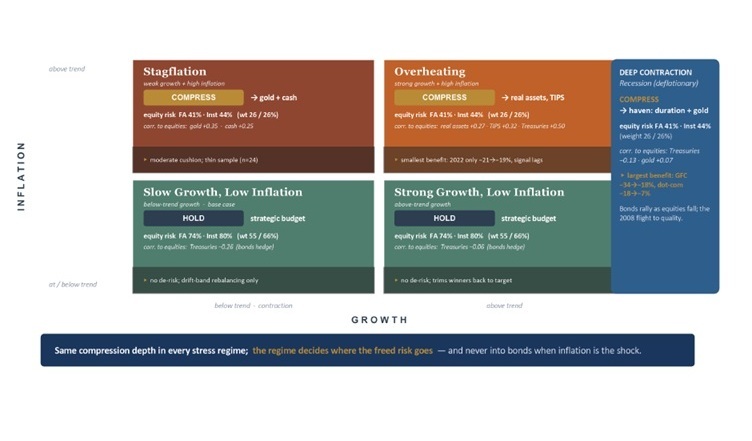
NDR’s Strategic Asset Allocation framework continues to evolve as market dynamics test traditional assumptions around diversification, risk, and portfolio construction. In this SAA two-part series,...
Chart of the Week
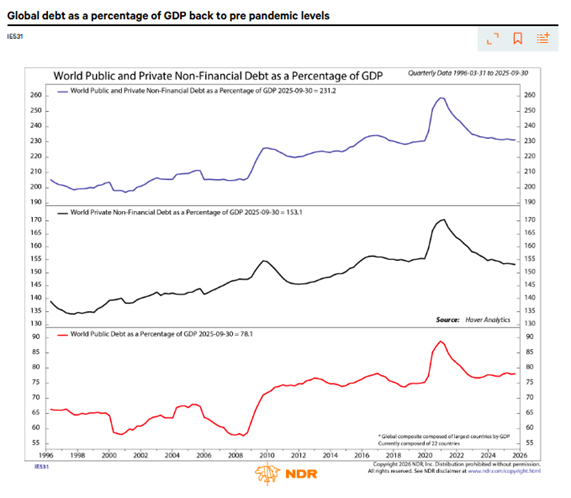
Global debt ratios have fallen back to pre-pandemic levels, reaching 231% of GDP, as private sector deleveraging offsets still elevated public borrowing (chart above). While both public and private...
Chart of the Week
In this Signals in Focus, NDR's Strategic Asset Allocation Strategist, Saumen Chattopadhyay, CFA explains how NDR’s forward-looking SAA framework is shaping portfolio construction.
Chart of the Week
Recorded May 14, 2026 - in this episode, NDR's Chief Economist Alejandra Grindal discusses the impact of the war on global supply chains and inflation. Alejandra notes that NDR's Global Supply Chain...
Chart of the Week
In 2021, trimmed-mean PCE lagged both headline and core inflation in detecting the pandemic-driven surge. Today, a similar risk exists: supply shocks from the Iran war and tariffs are pushing...
Chart of the Week
In this Signals in Focus interview, Saumen Chattopadhyay, CFA, Strategic Asset Allocation Strategist at NDR, discusses what sets NDR’s approach apart in an increasingly commoditized landscape.
Chart of the Week
In this Signals in Focus interview, Saumen Chattopadhyay, CFA, Strategic Asset Allocation Strategist at NDR, explains how disciplined, data driven frameworks can challenge conventional strategic...
Chart of the Week
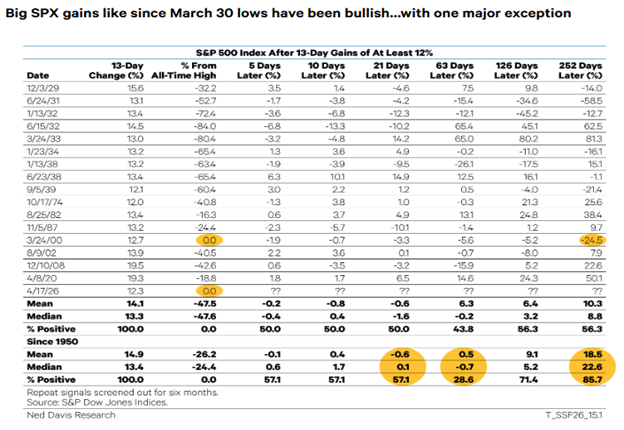
Client reactions to recent market swings can best be described as remarkable, though not bewildering to seasoned investors. The most common question has been what to do now. This report draws one key...
Chart of the Week
Historically, powerful rebounds like the recent surge in the S&P 500 have usually pointed to continued strength, especially when they follow major bear market lows. In most past examples, similar...
Chart of the Week
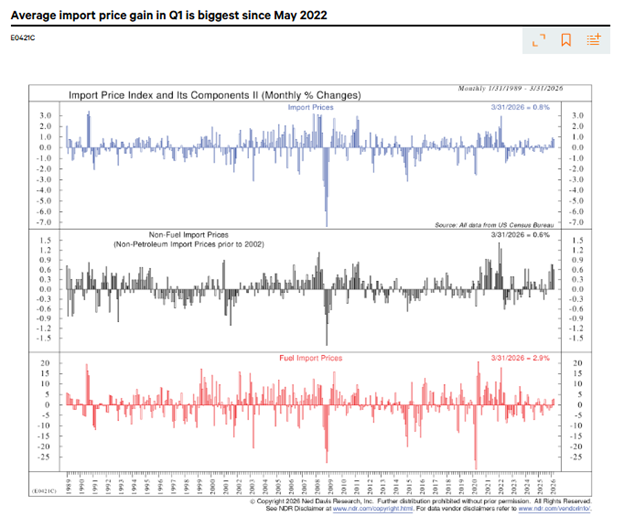
U.S. import prices rose 0.8% in March, less than expected, suggesting the early impact of the Iran war was more limited than feared. Still, prices increased an average of 0.7% per month in Q1, the...


_0.png)