
Chart of the Week
NDR: What the hot CPI report means for stocks
Last Tuesday’s CPI report shifted consensus for the first rate cut into H2, and for two fewer cuts over the next year. The change came after a series of strong economic reports began eliminating the risk of a hard landing in the near-term. But reduced the odds of a soft landing too. Under a no landing scenario, why the rush to cut rates? Yields rose across the curve, with the 10-year spiking to a 2.5-month high. The news hit equities hard - the S&P 500 slumped 1.4%.
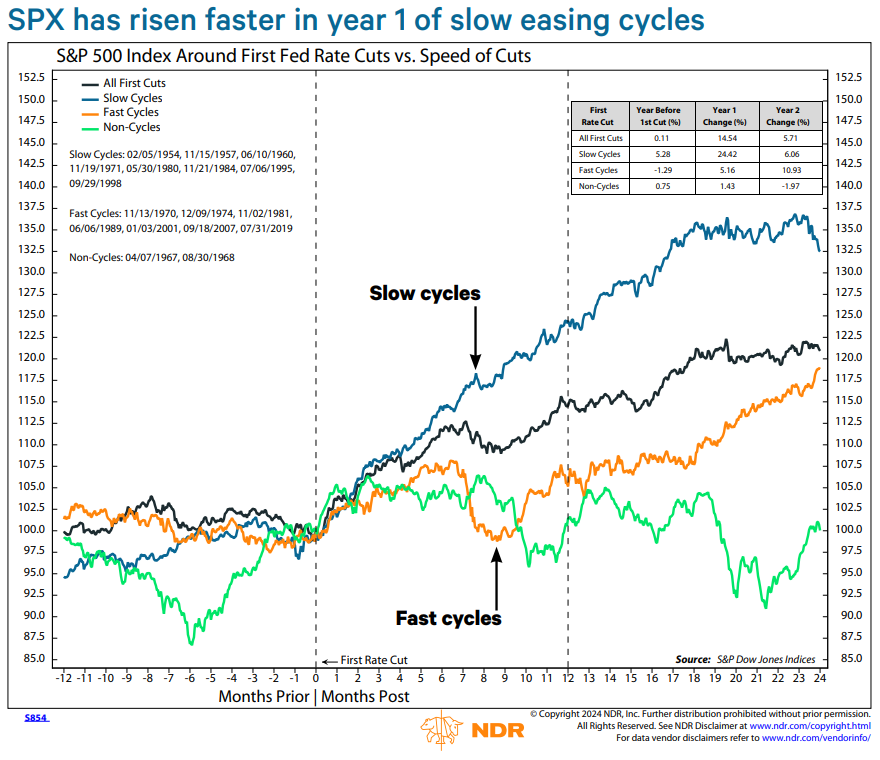
On the surface, fewer cuts may seem bearish for stocks, with higher bond yields providing more competition. However analysis by NDR’s Chief U.S. Strategist Ed Clissold shows that speed matters, with a slower pace bullish for equities historically. We define fast cycles as five or more hikes a year, and slow cycles as four or fewer. The chart above shows the S&P 500 has posted stronger gains in the first year of slow cycles. Assuming inflation and the economy aren’t too hot to prevent any rate cuts, the market’s pricing out rate cuts is a bullish development for equities. To access the full publication please fill out the form to the right, or click here to participate in our trial program.