In the News
In this special edition episode, Scott Slayton, Partner and Chief Strategist at Capital Creek Partners, hosts Joe Kalish, Chief Global Macro Strategist at Ned Davis Research Group. Topics discussed...
See the Signals
In this episode, NDR's Chief Economist Alejandra Grindal discusses the trajectories for the U.S. and Chinese economies. In the first half of the year, China exceeded its government's growth goal of...
In the News
In a recent episode of Money Life with Chuck Jaffe, Joe Kalish, Chief Macro Strategist at Ned Davis Research, shared his optimistic outlook on the markets. Titled “NDR's Kalish: Fading uncertainty...
Chart of the Week
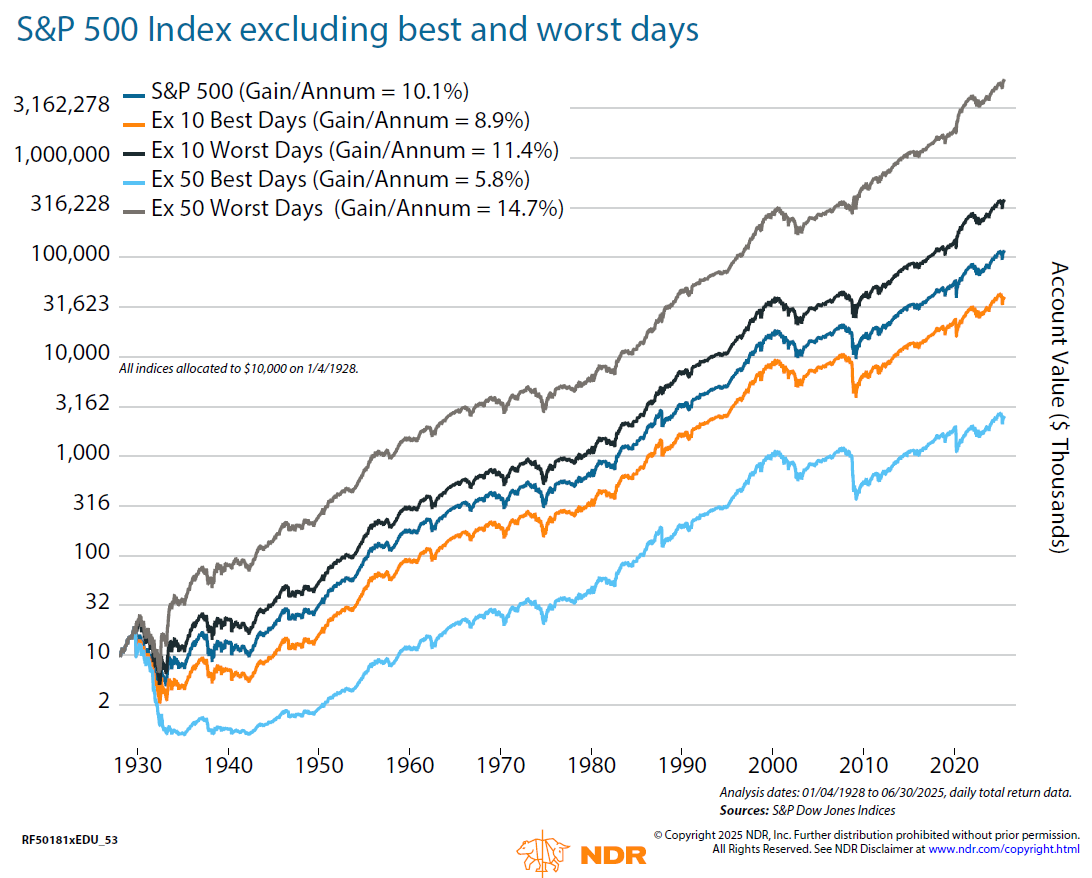
In the latest edition of NDR’s Integrated Analyst, the Custom Research Solutions (CRS) team takes a critical look at one of the most cited arguments against market timing: the idea that missing just...
Chart of the Week
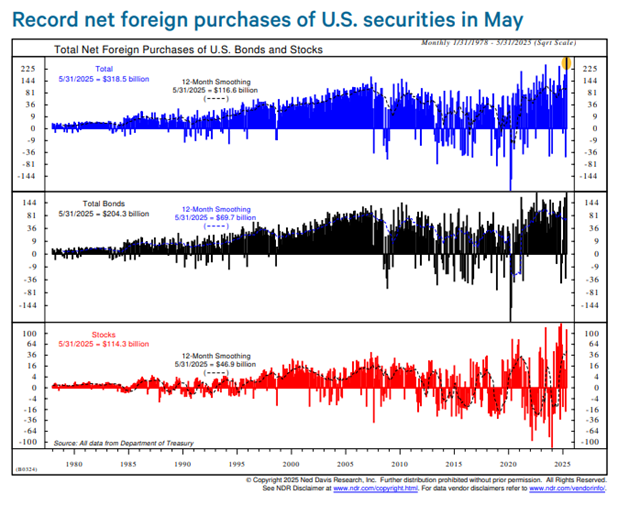
After stepping back in April, foreign investors returned to U.S. markets in force in May, with net purchases of long-term U.S. securities hitting a record $318.5 billion (chart above). Bond buying...
See the Signals
In this episode, NDR's Chief Economist Alejandra Grindal discusses the second half outlook for the global economy. Policy uncertainty has been a key influence so far in 2025. Most of the major...
Wealth Management
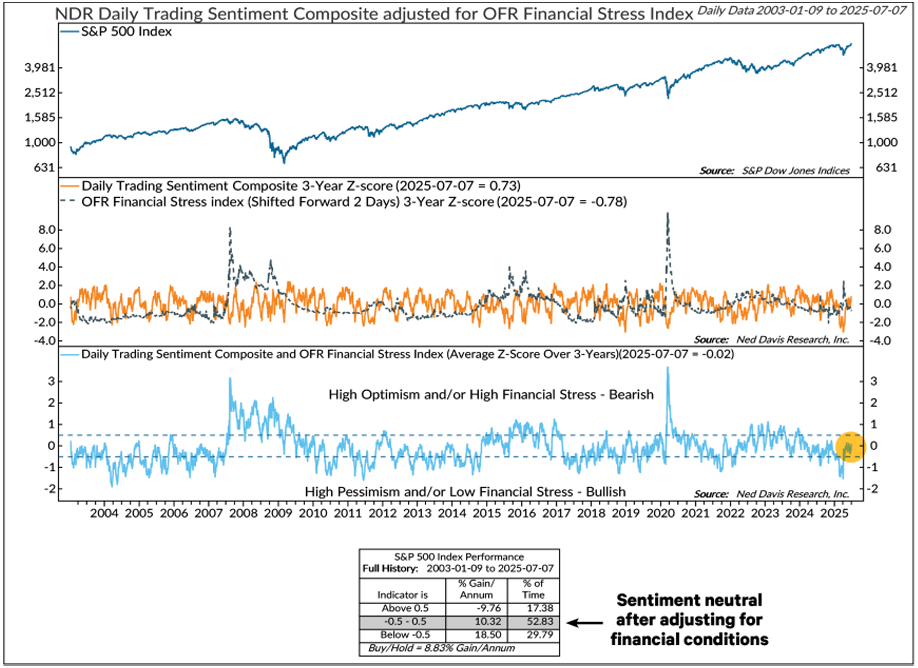
Market sentiment indicators are a staple in many investors’ toolkits — but are they telling the full story?
See the Signals
In our latest episode of Signal Exchange, NDR’s Chief Thematic Strategist, Pat Tschosik, CFA, CMT, explores the three keys to thematic investing: understanding long-duration assets, managing...
Wealth Management
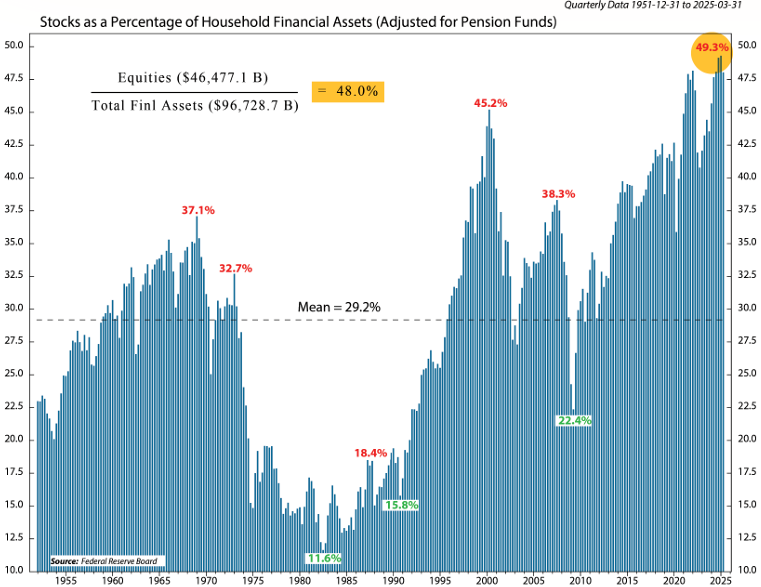
Investor stock allocations are hovering near record highs — not just among households, but also institutions and foreign buyers. While this may reflect optimism, history suggests it could be a...
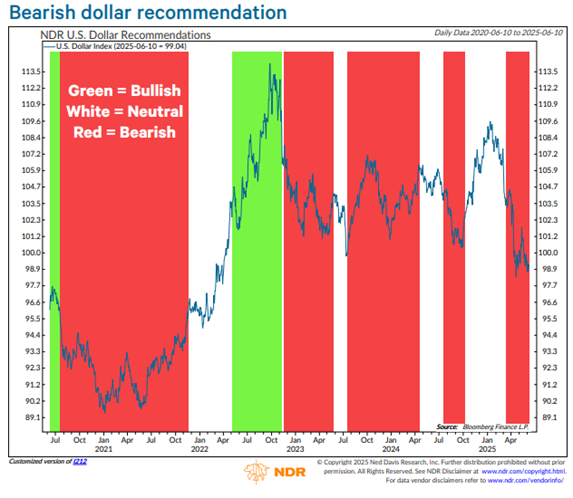
Chart of the Week
Since its April 21 low, the U.S. Dollar Index has fluctuated and now hovers just above that level, raising questions about a breakdown or successful test. Bearish signals dominate, with all three of...