Chart of the Week
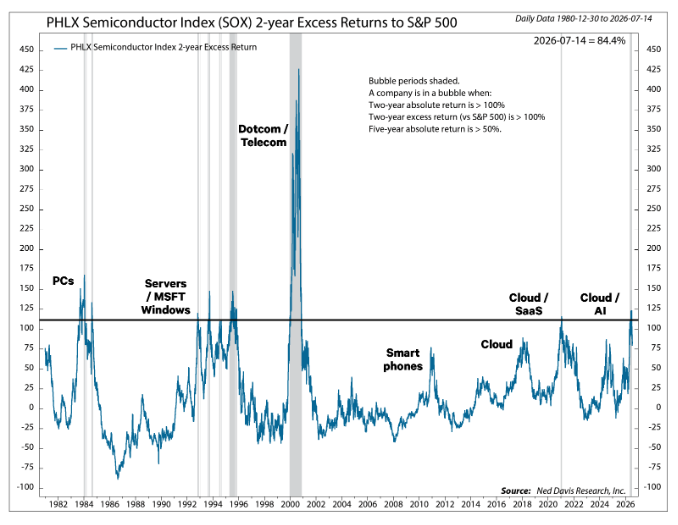
Following NDR's July 16 webinar, The AI Datacenter Boom: Bubble, Supercycle, or Something In Between?, investors are asking an important question: what could bring the AI datacenter boom to an end?
Chart of the Week
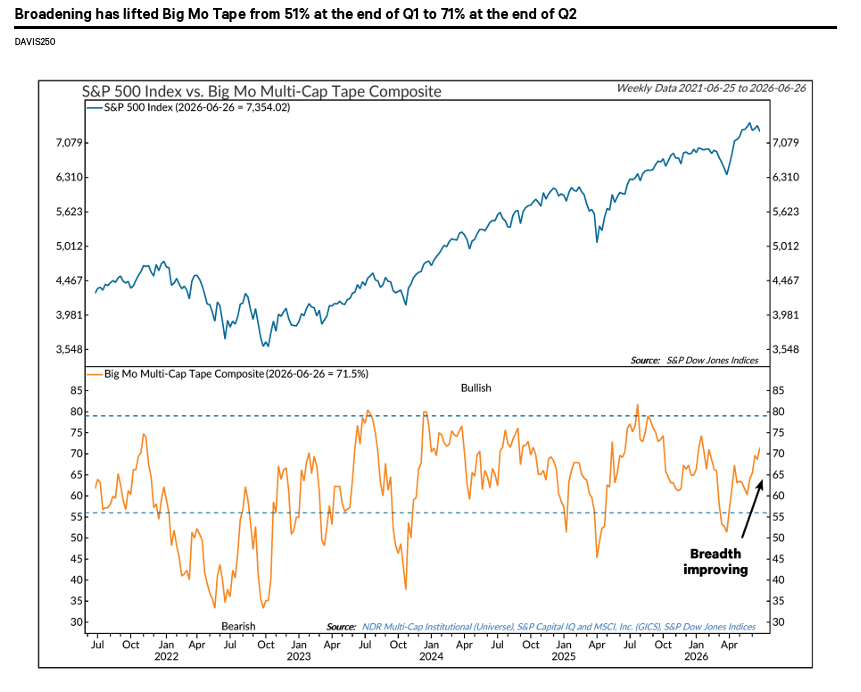
Market leadership is evolving. While investors have focused heavily on a narrow group of market winners in recent quarters, recent market action suggests participation may be broadening as...
Chart of the Week
NDR’s Strategic Asset Allocation team examines one of the most important questions facing allocators today: do private markets genuinely improve portfolio outcomes, or are their perceived benefits...
Chart of the Week
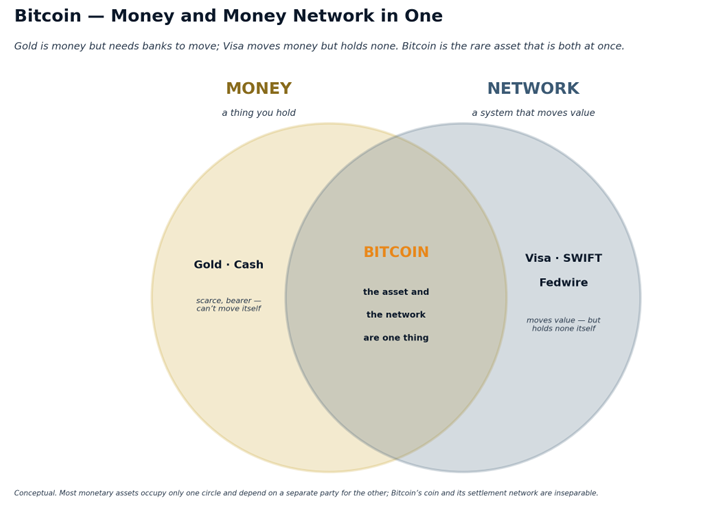
NDR’s Strategic Asset Allocation team explores a foundational shift underway in the financial system, driven by the emergence of bitcoin as both a new form of money and a new settlement network. What...
In the News
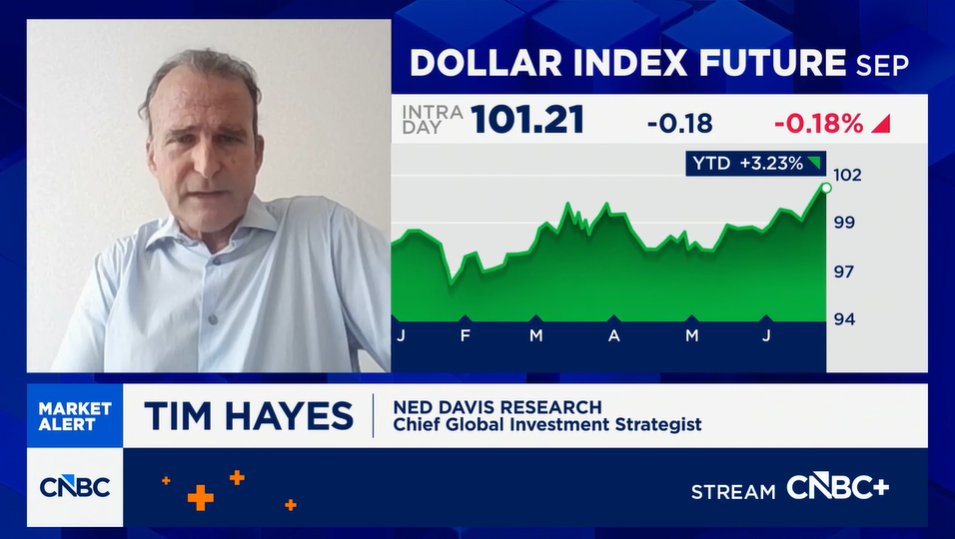
Tim Hayes, Chief Global Investment Strategist at Ned Davis Research, joined CNBC’s Closing Bell Overtime to highlight a key market driver: bond yields.
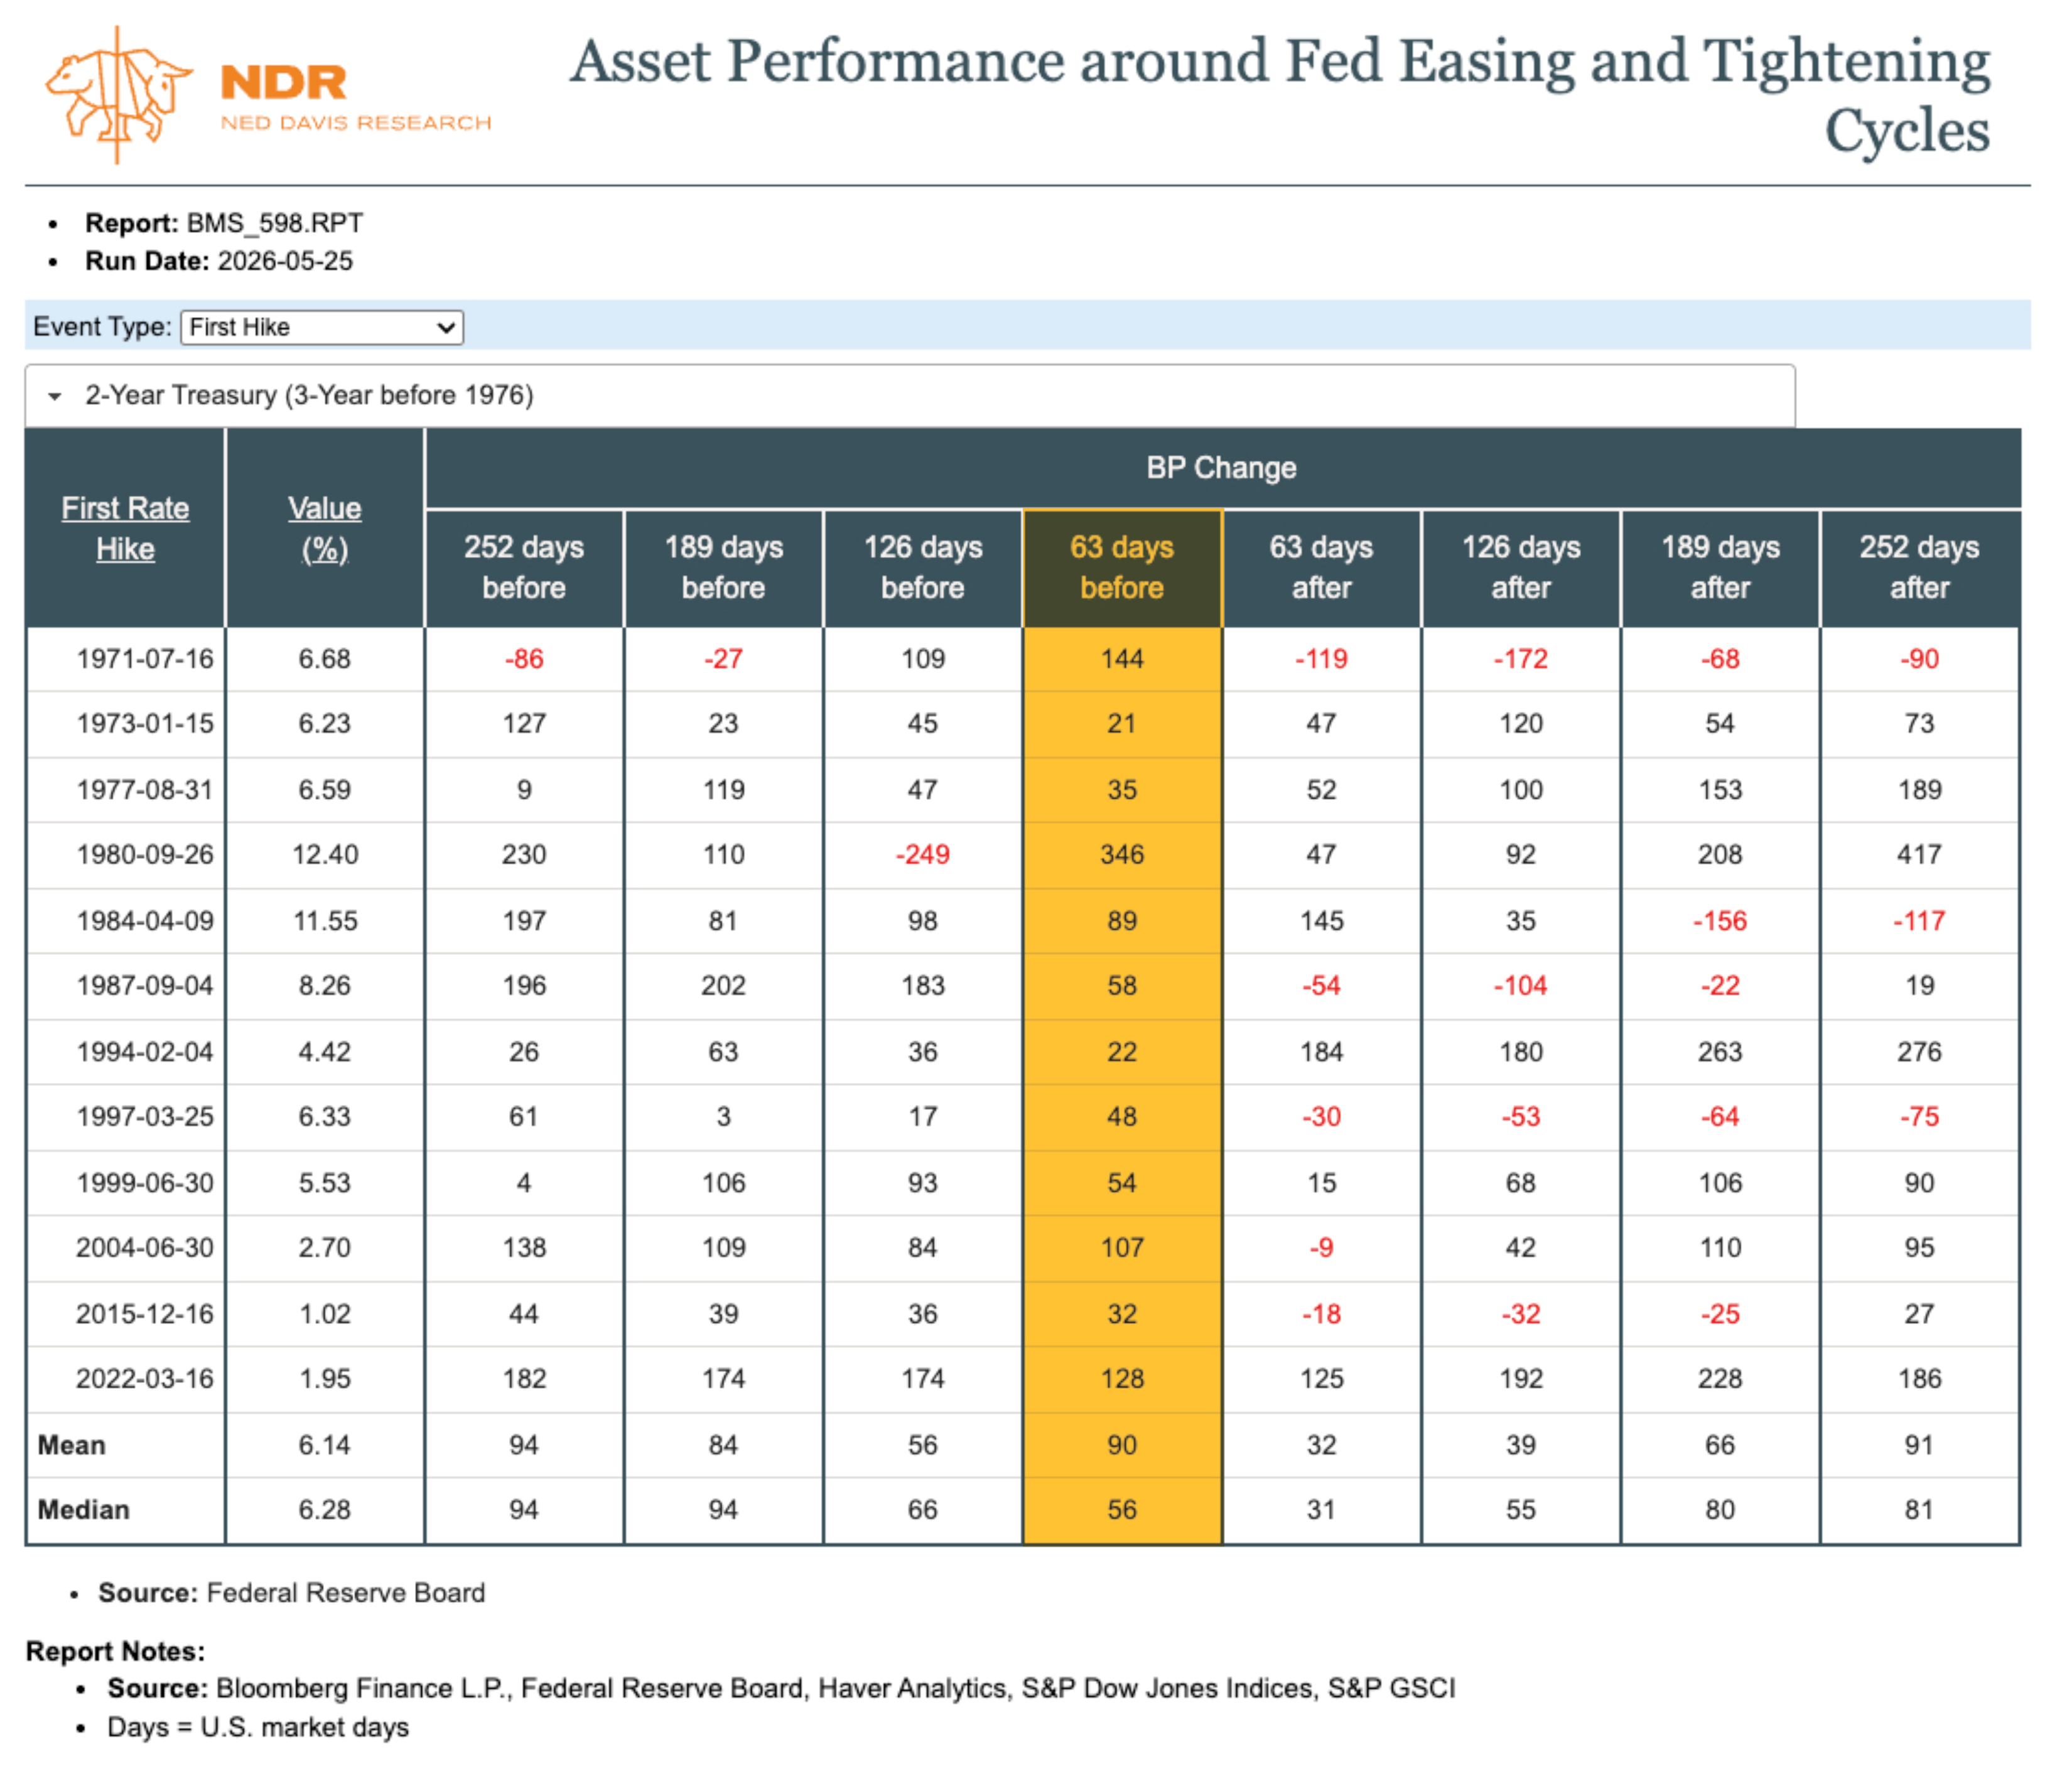
Chart of the Week
NDR’s latest macro view examines a meaningful shift in the Federal Reserve’s posture, as policymakers signal a more forceful commitment to restoring price stability even as inflation expectations...
Chart of the Week
Recorded June 9, 2026 - in this episode, NDR's Chief Economist Alejandra Grindal discusses China's economy. Alejandra notes that China’s economy is best described as resilient at the headline level...
Chart of the Week
Traditional portfolio construction often centers on the 60/40 framework, but many investors overlook a critical distinction: asset allocation is not the same as risk allocation. While portfolios may...
Wealth Management
In the latest edition of NDR’s Integrated Analyst, the Custom Research Solutions (CRS) team highlights how we maintain, enhance, and evolve NDR’s asset allocation models, including our most recently...
In the News
Joe Kalish, Chief Global Macro Strategist at Ned Davis Research, recently joined Chuck Jaffe on the Money Life podcast to share his outlook on the 2026 economy. Despite a steady stream of global...