
Chart of the Week
NDR: Price-earnings ratios still above average
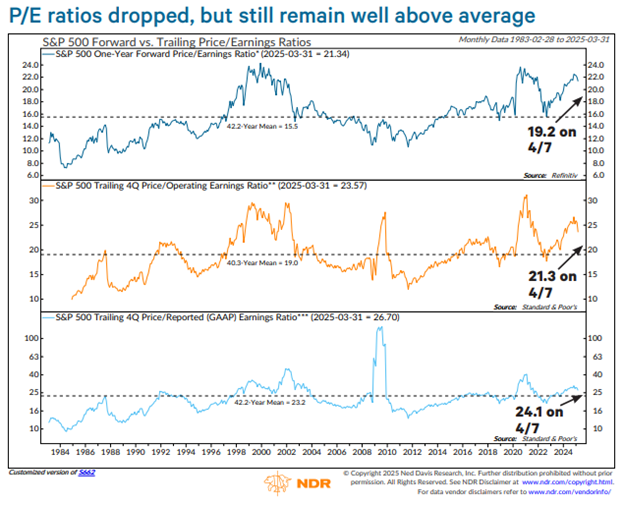
The stock market is one of the few places where buyers panic during a sale—but even after the Liberation Day selloff, S&P 500 valuations didn’t drop to bargain levels. Though the forward P/E fell 14% and trailing P/Es dropped about 20% from their November 2024 highs to April 2025 lows, all three remained above long-term averages (chart above). The forward P/E bottomed at 19.2 (vs. a 40-year average of 15.5), with trailing operating and GAAP P/Es at 21.3 and 24.1, respectively—still elevated. Like stores that mark up prices before offering a “sale,” valuations looked cheaper, but weren’t. Much of the limited decline in the forward P/E reflects falling earnings estimates, particularly for the first half of 2025, with Q1 EPS forecasts down 4.7% and Q2 down 2.9%, while Q4 remains flat.
Want deeper insights and data to inform your strategy? Sign up for a complimentary trial of the NDR platform and explore our full range of research tools by completing the form to the right. Delve deeper into the dynamics shaping the economic landscape and offer actionable strategies for investors. Let us help you, See the Signals.™ To subscribe to the NDR Blog click here.
Ned Davis Research, Inc. (NDR), or any affiliates or employees, or any third-party data provider, shall not have any liability for any loss sustained by anyone who has relied on the information contained in any NDR publication. The data and analysis contained herein are provided “as is.” NDR disclaim any and all express or implied warranties, including, but not limited to, any warranties of merchantability, suitability or fitness for a particular purpose or use. Past recommendations and model results are not a guarantee of future results. Using any graph, chart, formula or other device to assist in deciding which securities to trade or when to trade them presents many difficulties and their effectiveness has significant limitations, including that prior patterns may not repeat themselves continuously or on any particular occasion. In addition, market participants using such devices can impact the market in a way that changes the effectiveness of such device. This communication reflects our analysts’ opinions as of the date of this communication and will not necessarily be updated as views or information change. All opinions expressed herein are subject to change without notice. NDR, or its affiliated companies, or their respective shareholders, directors, officers and/or employees, may have long or short positions in the securities discussed herein and may purchase or sell such securities without notice.