
Chart of the Week
NDR: Rare territory for sentiment
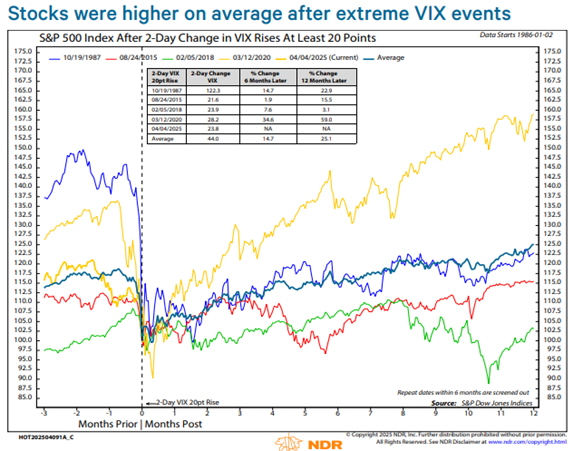
The recent 23.8-point surge in the S&P 500 Volatility Index (VIX) over just two days places the “Trump Tariff Tantrum” among some of the most significant short-term panic events in market history. These include the 1987 “Black Monday” crash, the 2015 “China Black Monday” and yuan devaluation, the 2018 “Volmageddon” and XIV low-vol ETF collapse, and the 2020 Covid-driven volatility. Each of these spikes reflected moments of intense fear, yet history shows that the market typically rebounded within 12 months. Similarly, the NDR Daily Trading Sentiment Composite recently experienced a sharp decline, dropping 25 points in six days—from an already low reading of 33.3 to just 7.8. This marks the only instance since 1984 of such a large drop from a starting point below 34, with sentiment reaching a record-tying low of 4.4 on April 7, highlighting extreme pessimism. While sharp downturns may trigger a reflex to exit the market, historical patterns suggest that caution—rather than panic—is the wiser course.
Although markets often see a relief rally following periods of deep negativity, such oversold conditions rarely offset the broader impact of an early-stage recession. On average, cyclical bear markets for the Dow Jones Industrial Average last 353 market days with a 34.6% decline.
Want deeper insights and data to inform your strategy? Sign up for a complimentary trial of the NDR platform and explore our full range of research tools by completing the form to the right. Delve deeper into the dynamics shaping the economic landscape and offer actionable strategies for investors. Let us help you, See the Signals.™ To subscribe to the NDR Blog click here.
Ned Davis Research, Inc. (NDR), or any affiliates or employees, or any third-party data provider, shall not have any liability for any loss sustained by anyone who has relied on the information contained in any NDR publication. The data and analysis contained herein are provided “as is.” NDR disclaim any and all express or implied warranties, including, but not limited to, any warranties of merchantability, suitability or fitness for a particular purpose or use. Past recommendations and model results are not a guarantee of future results. Using any graph, chart, formula or other device to assist in deciding which securities to trade or when to trade them presents many difficulties and their effectiveness has significant limitations, including that prior patterns may not repeat themselves continuously or on any particular occasion. In addition, market participants using such devices can impact the market in a way that changes the effectiveness of such device. This communication reflects our analysts’ opinions as of the date of this communication and will not necessarily be updated as views or information change. All opinions expressed herein are subject to change without notice. NDR, or its affiliated companies, or their respective shareholders, directors, officers and/or employees, may have long or short positions in the securities discussed herein and may purchase or sell such securities without notice.