Chart of the Week
NDR: Presidential cycles often start weak and gain momentum

Since March 2009, NDR has identified the ongoing secular bull market for stocks, while noting that the current cyclical trend turned bullish again in October 2022. However, with optimism currently running high, now is an opportune time to assess potential risks and remain flexible should market trends weaken in the coming year.
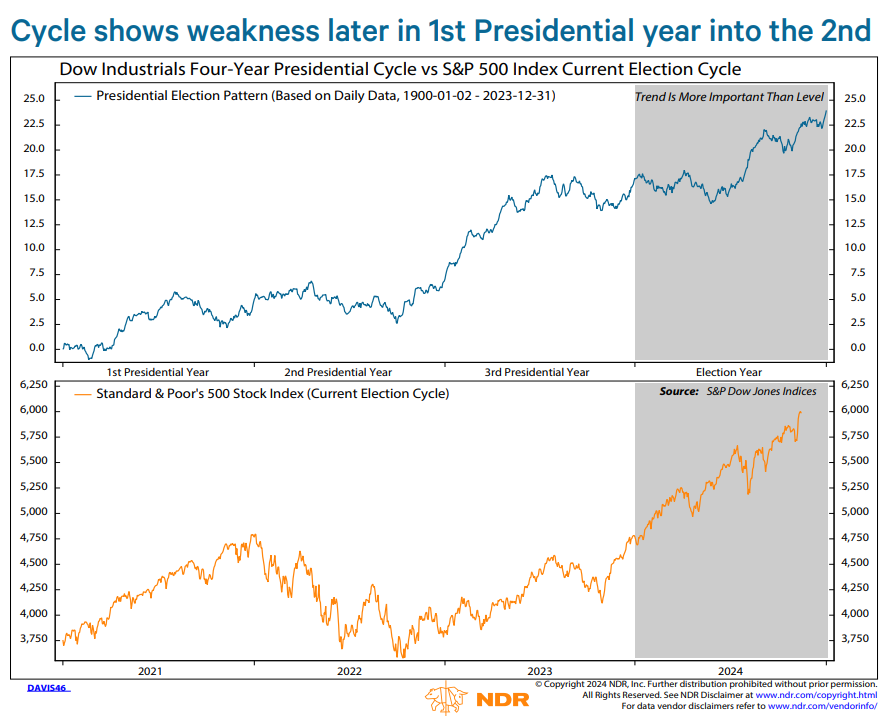
Given the timing post-election, it might be useful to revisit the presidential election cycle. Historically, the bull market often extends into the first year following a presidential election. However, the initial two years tend to be volatile, with many bear markets beginning in the first year and continuing into the midterm election year (chart above). For instance, a bear market started in 2021 and persisted into 2022. This pattern could stem from shifts in fiscal policy that sometimes yield unintended consequences. As politicians typically work to stimulate the economy ahead of the next presidential election, the market often rallies strongly in the third and fourth years of the cycle, similar to the robust gains seen in 2023 and 2024.
Want deeper insights and data to inform your strategy? Sign up for a complimentary trial of the NDR platform and explore our full range of research tools by completing the form to the right. Delve deeper into the dynamics shaping the economic landscape and offer actionable strategies for investors. Let us help you, See the Signals.™
Ned Davis Research, Inc. (NDR), or any affiliates or employees, or any third-party data provider, shall not have any liability for any loss sustained by anyone who has relied on the information contained in any NDR publication. The data and analysis contained herein are provided “as is.” NDR disclaim any and all express or implied warranties, including, but not limited to, any warranties of merchantability, suitability or fitness for a particular purpose or use. Past recommendations and model results are not a guarantee of future results. Using any graph, chart, formula or other device to assist in deciding which securities to trade or when to trade them presents many difficulties and their effectiveness has significant limitations, including that prior patterns may not repeat themselves continuously or on any particular occasion. In addition, market participants using such devices can impact the market in a way that changes the effectiveness of such device. This communication reflects our analysts’ opinions as of the date of this communication and will not necessarily be updated as views or information change. All opinions expressed herein are subject to change without notice. NDR, or its affiliated companies, or their respective shareholders, directors, officers and/or employees, may have long or short positions in the securities discussed herein and may purchase or sell such securities without notice.

