
Chart of the Week
NDR: Nontraditional Metrics Show Stocks Not Cheap
The 20% rally off the October lows has pushed already elevated traditional valuation metrics even higher. The S&P 500 Index is trading at 22.8 times trailing operating earnings, the highest since December 2021.
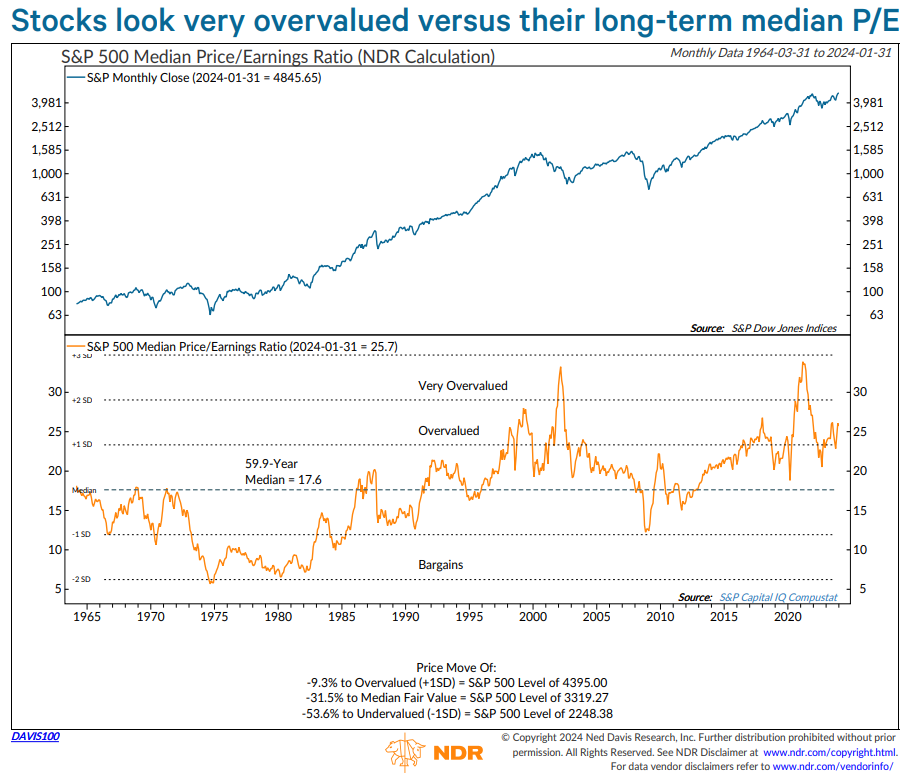
But as NDR’s Chief U.S. Strategist Ed Clissold points out, valuations need context. Market structures have changed so much that comparing a P/E to the last century isn’t apples to apples. Sector composition has shifted, companies have divested lower-margin businesses, and CFOs are more focused the bottom line. Simple regression analysis shows the S&P 500 median P/E is 25.7, while the long-term median is 17.6, implying the S&P 500 is 46% overvalued (chart above). But comparing the median P/E to its trendline since 1964 suggests only 5.4% overvaluation. Cash-adjusted P/E, which removes both cash and the generated income, at 21.8 is less than one standard deviation above its long-term mean. However the old Wall Street adage of the “rule of 20” says that if CPI + P/E is above 20, the S&P 500 is overvalued. We analyzed the rule and found 23.7 to have a better track record. To access the full publication please fill out the form to the right, or click here to participate in our trial program.