
Chart of the Week
NDR: Improved Market Breadth a bullish indicator for equities?
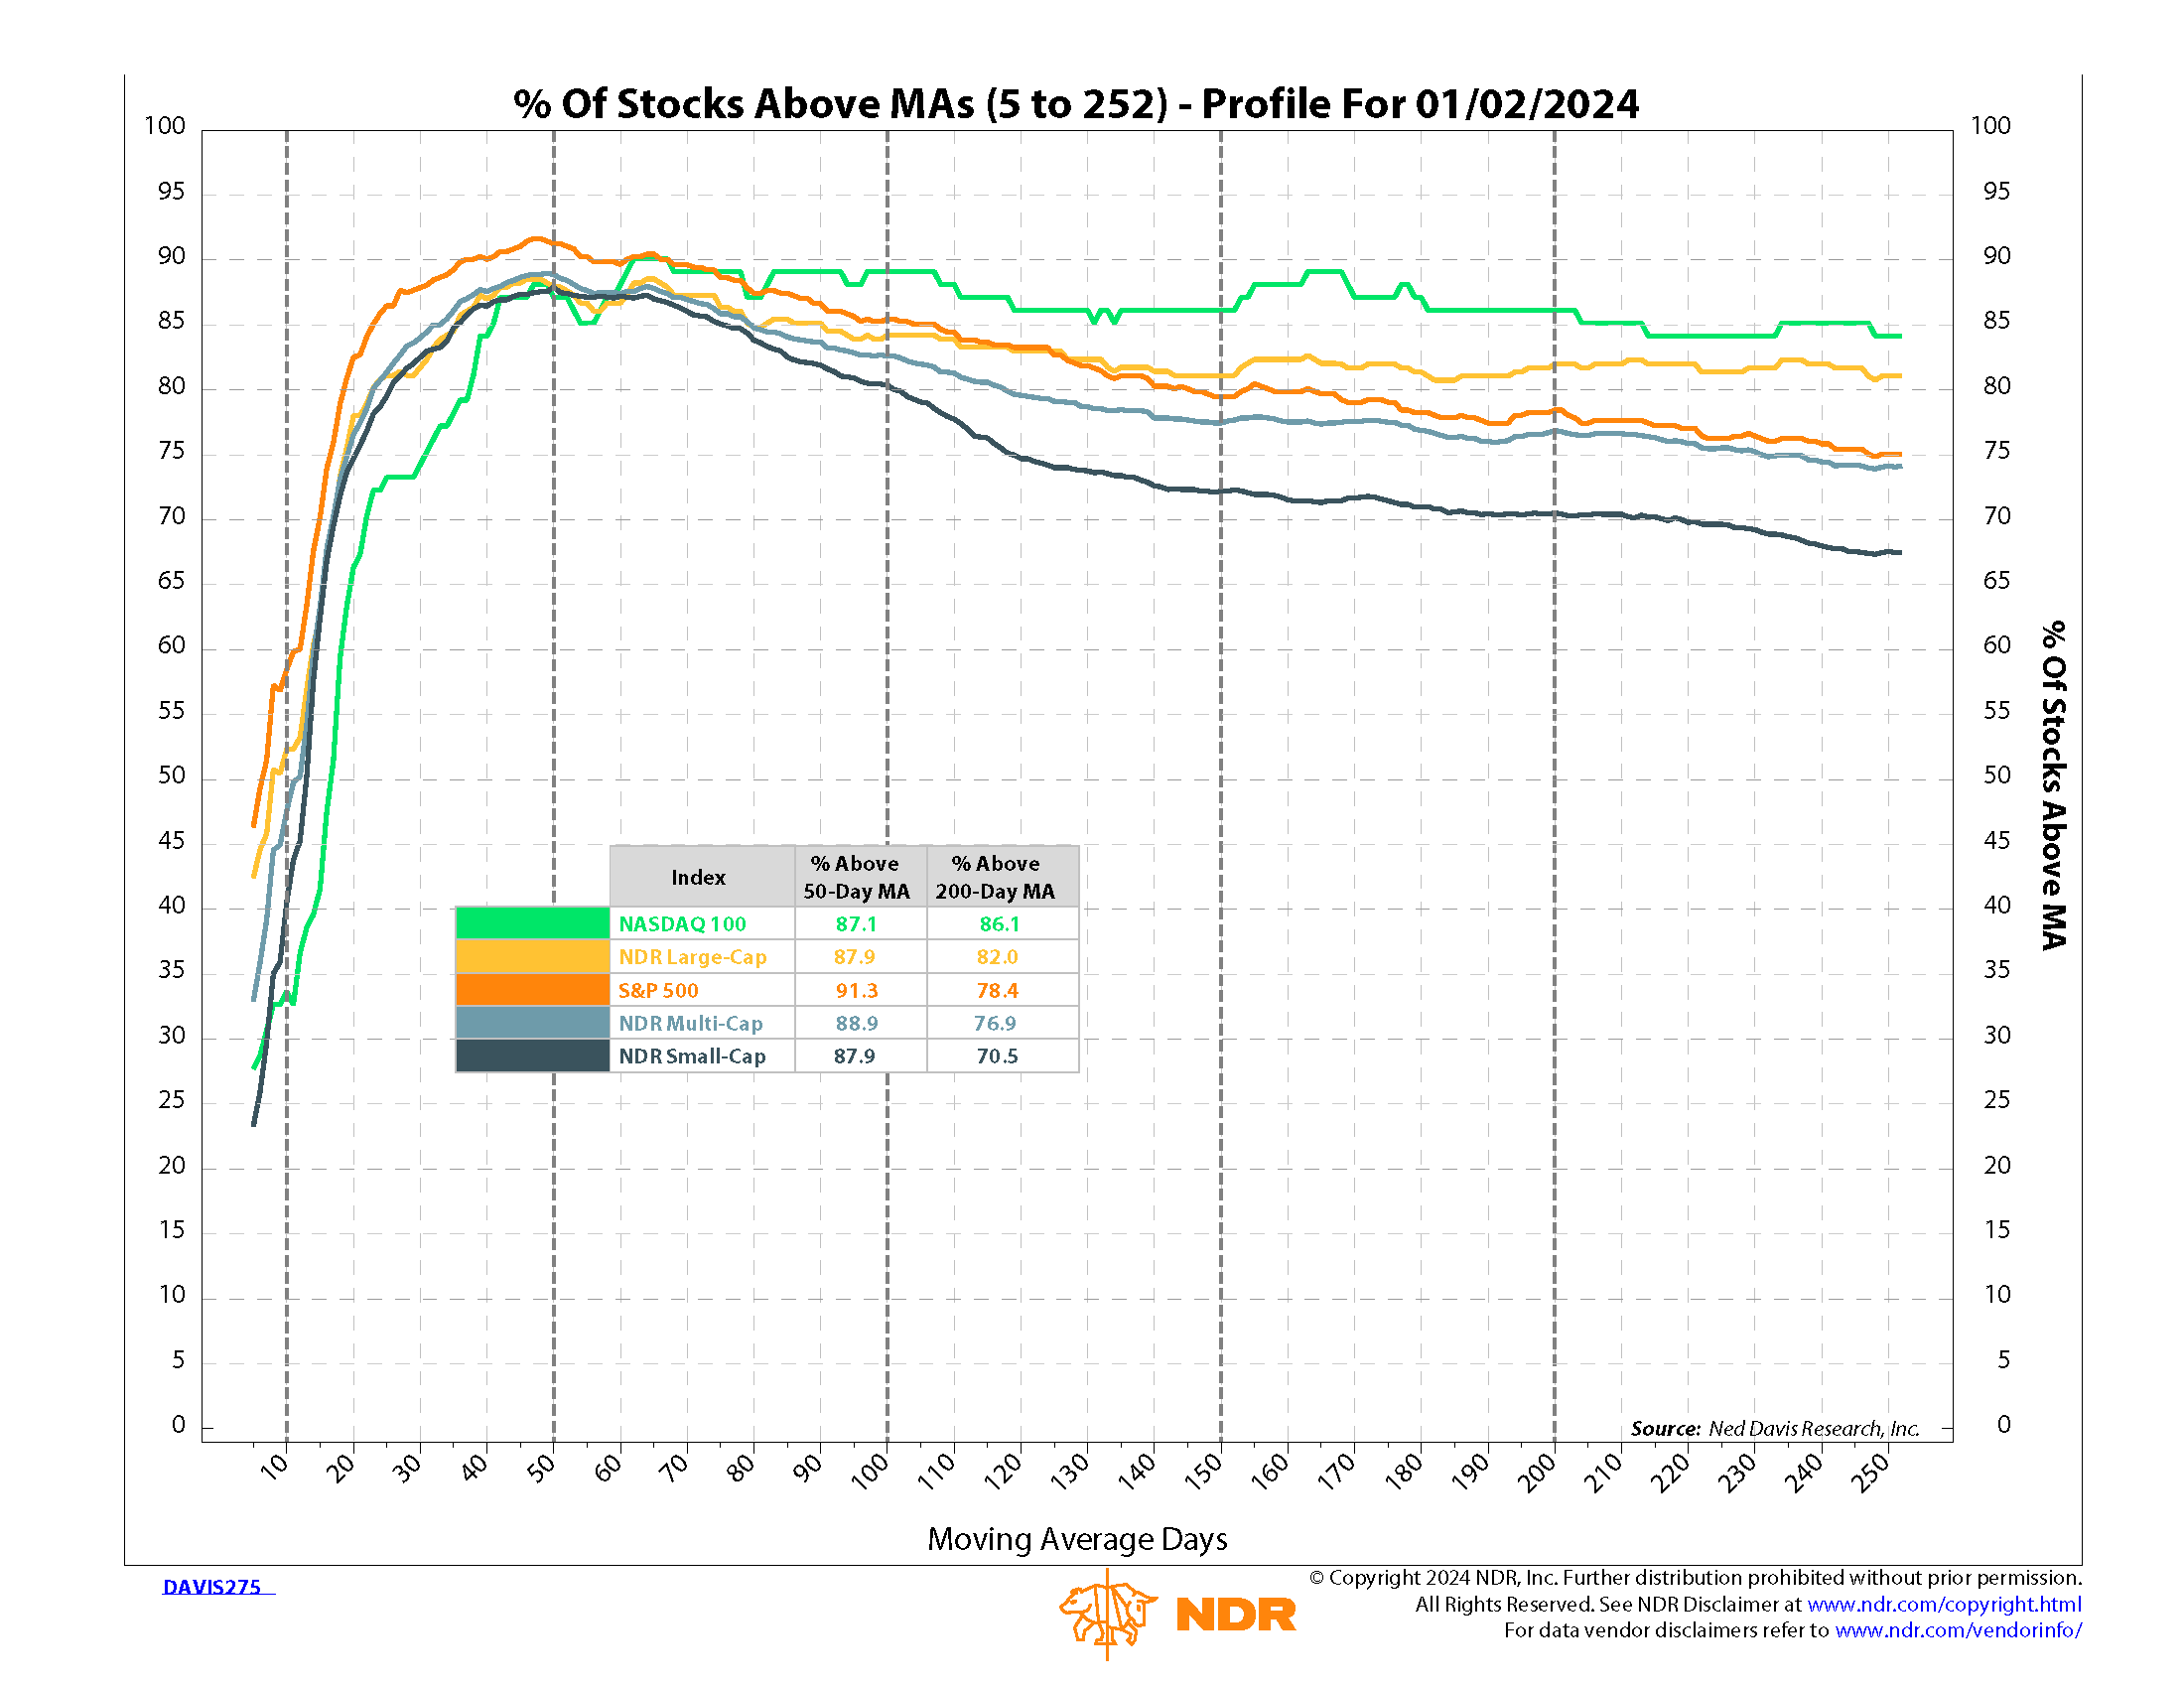
This NDR chart, % Of Stocks Above MAs (5 to 252), that we refer to as DAVIS 275, plots the percentage of stocks, for five equity indexes, trading above their moving averages ranging from five to 252 days.
All of the indexes show the percentage of stocks above their 50-day moving averages, above 85%. With none falling below 70% out to their 200-day averages, this tends to be an indicator of broad participation across U.S. equity markets and provides a potentially bullish signal for U.S. equities.
Interestingly, fixed income indexes are also experiencing widespread participation, particularly U.S. credit indexes.
To learn more about NDR’s offering fill out the form to the right to get more information.