
Chart of the Week
NDR: A Trickier 2nd Half?
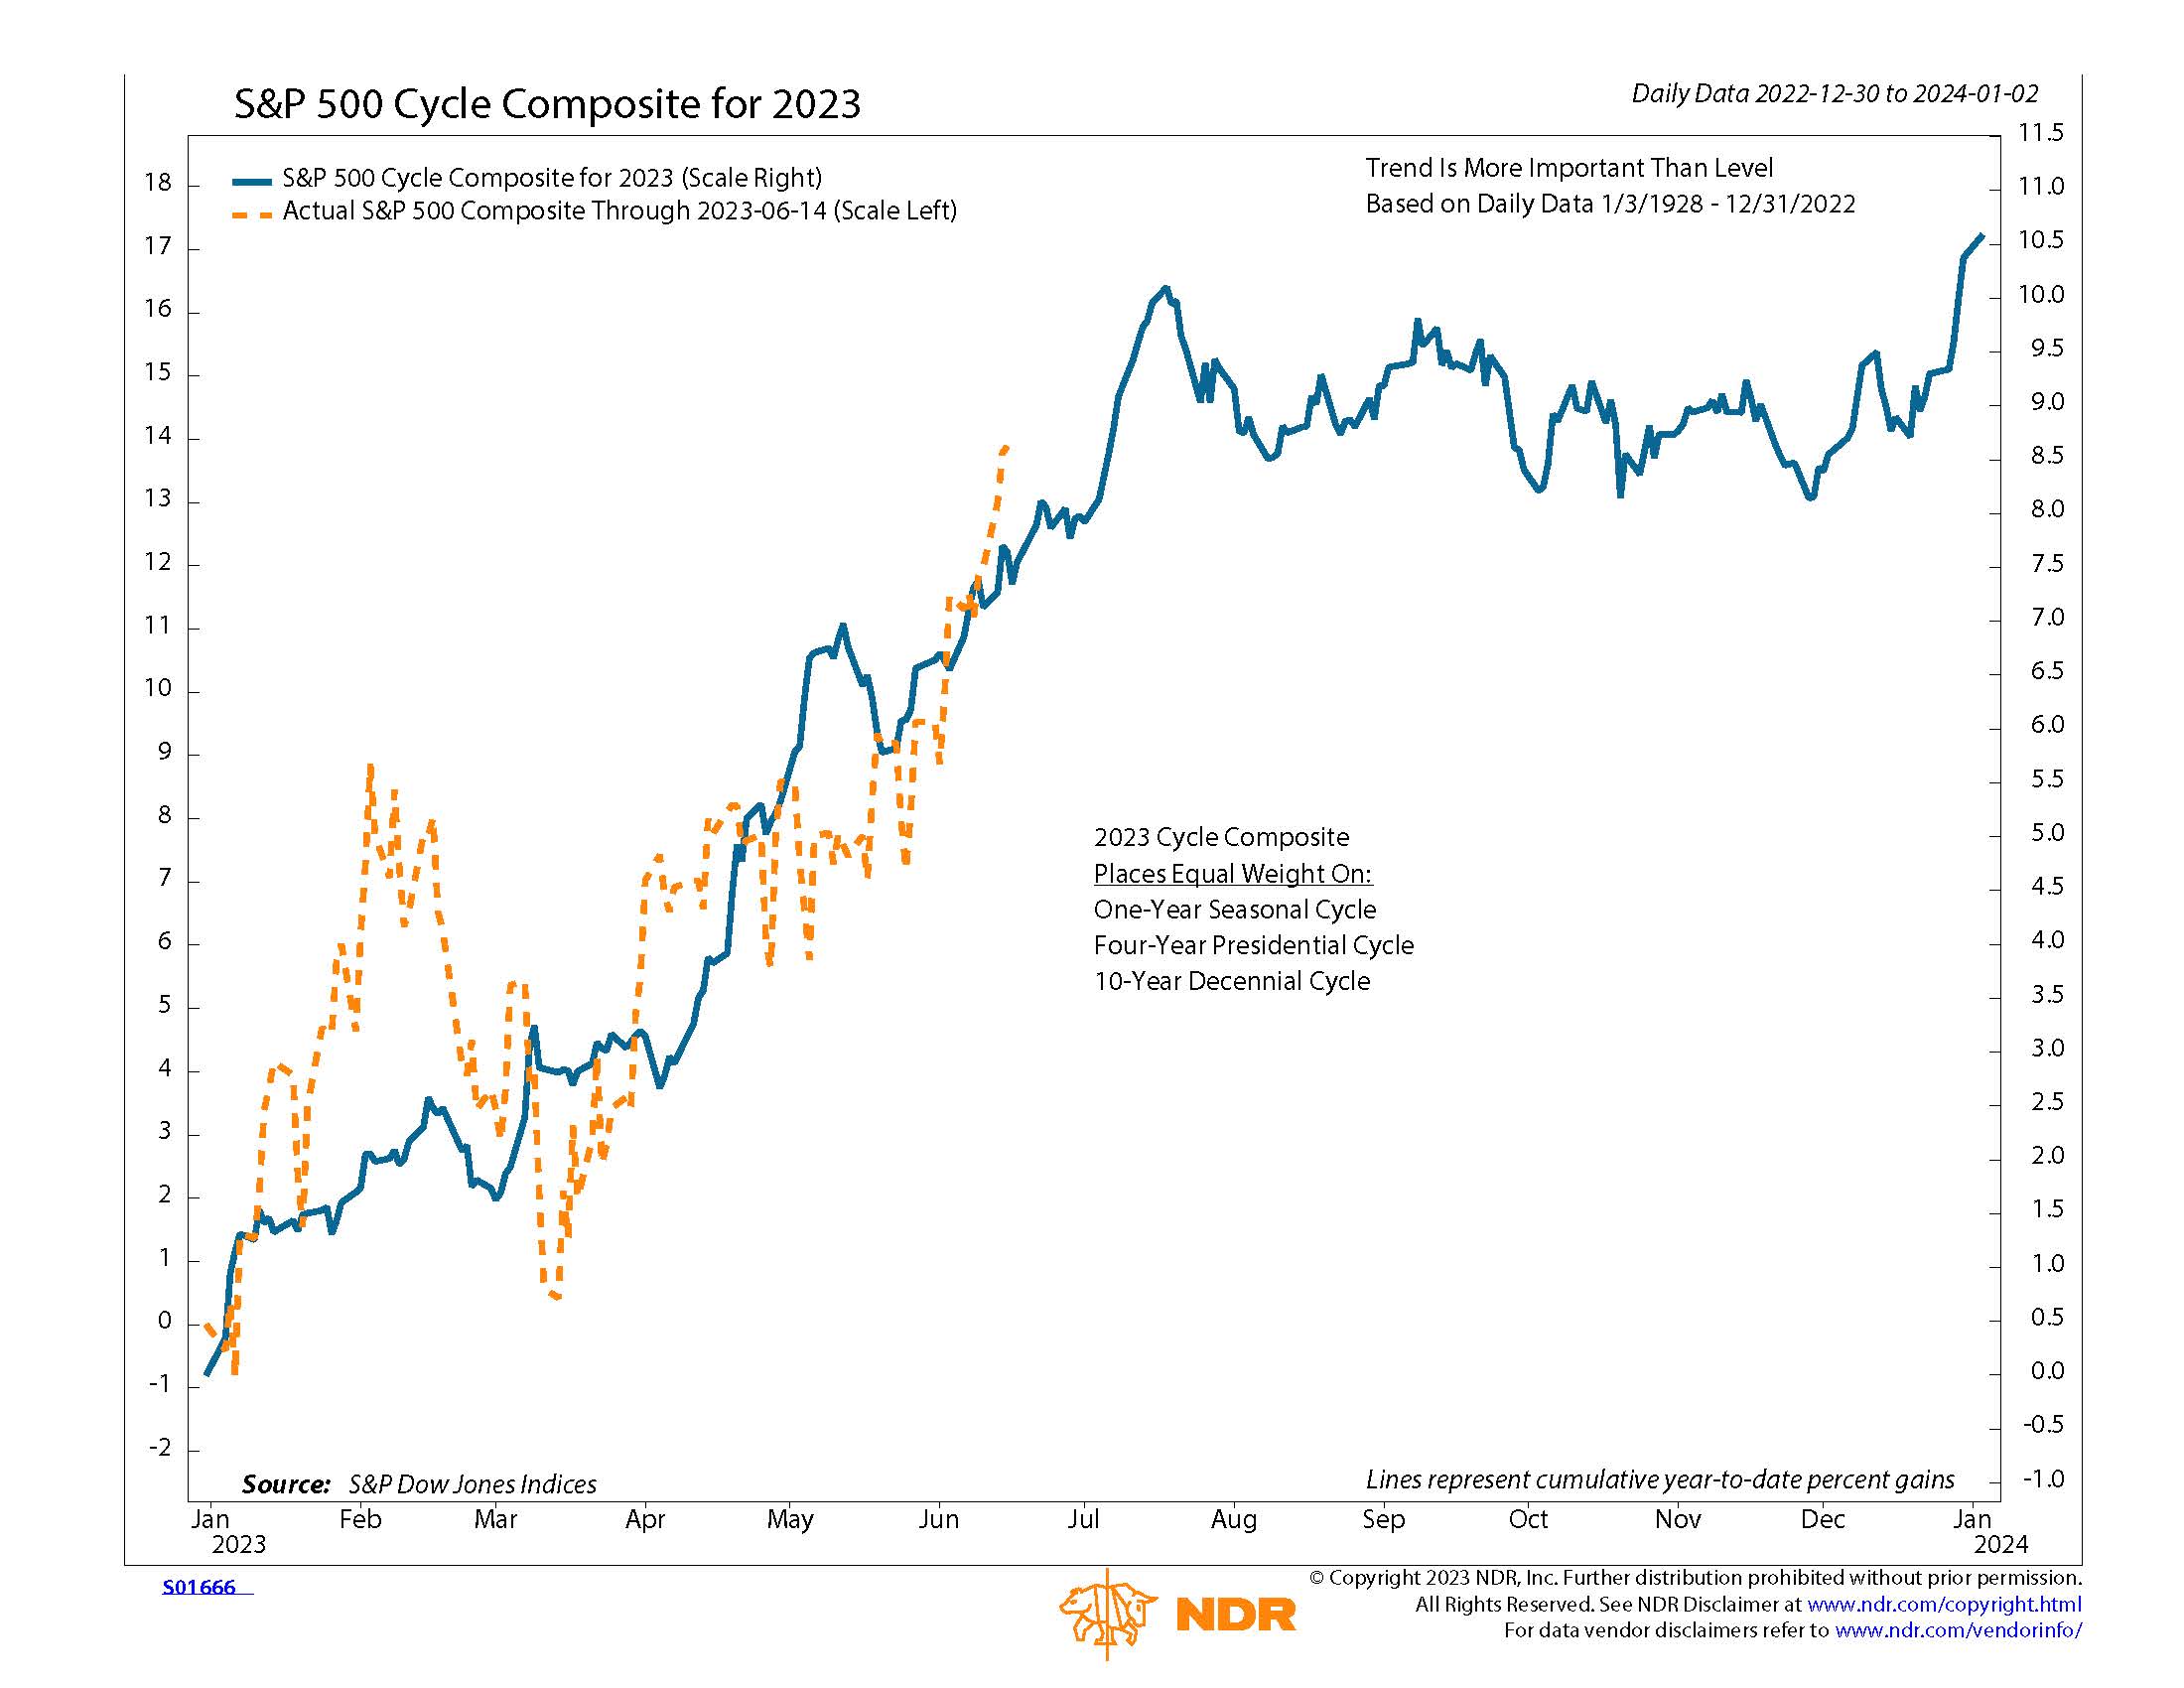
NDR Cycle Composite charts combine three price patterns to offer a historical perspective on how the year may unfold: 1) The one-year seasonal cycle; 2) The four-year presidential cycle; and 3) The decennial cycle. While Wall Street was about as pessimistic as it had been in decades coming into the year, our 2023 Cycle Composite signaled a strong first half of the year, choppiness through November, and a year-end rally. This contrarian picture, combined with widespread pessimism, better-than-expected economic data, and technical indicator improvement provided NDR Chief U.S. Strategist Ed Clissold with the “weight of the evidence” confirmation needed to overweight U.S. equities in January. In his 2H23 Outlook publication, he walks through the drivers of the composite for the first half of the year and outlines the message from here.