
Chart of the Week
NDR: Most long-term stock trend charts look overvalued
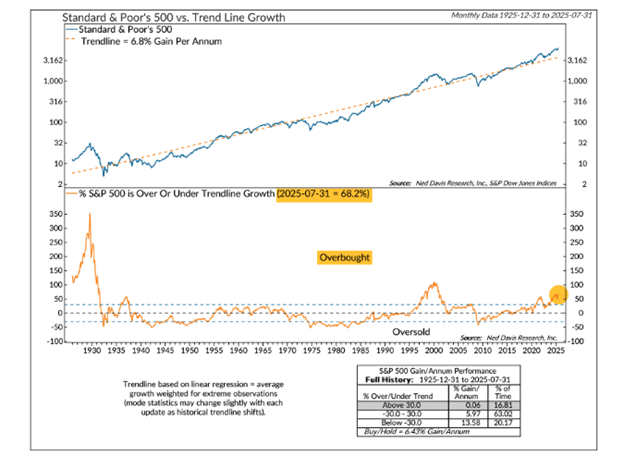
Most long-term stock trend charts suggest equities are overvalued, though total return measures paint a less extreme picture. Housing and the U.S. Dollar also appear overvalued, while gold is nearing overvalued levels and oil looks undervalued relative to its long-term trend. Charts of the real S&P 500 Index show it trading well above its historical growth trend of 6.8% since 1925, reaching levels not seen since 2000 (chart above).
However, when considering the S&P 500 Total Return Index, which includes dividends, stocks appear less overvalued, reflecting the shift toward buybacks and reinvestment rather than direct dividend payouts.
Despite this, most long-term stock charts remain overextended, and valuations are high by traditional metrics.
Want deeper insights and data to inform your strategy? Sign up for a complimentary trial of the NDR platform and explore our full range of research tools by completing the form to the right. Delve deeper into the dynamics shaping the economic landscape and offer actionable strategies for investors. Let us help you, See the Signals.™ To subscribe to the NDR Blog click here.
Ned Davis Research, Inc. (NDR), or any affiliates or employees, or any third-party data provider, shall not have any liability for any loss sustained by anyone who has relied on the information contained in any NDR publication. The data and analysis contained herein are provided “as is.” NDR disclaim any and all express or implied warranties, including, but not limited to, any warranties of merchantability, suitability or fitness for a particular purpose or use. Past recommendations and model results are not a guarantee of future results. Using any graph, chart, formula or other device to assist in deciding which securities to trade or when to trade them presents many difficulties and their effectiveness has significant limitations, including that prior patterns may not repeat themselves continuously or on any particular occasion. In addition, market participants using such devices can impact the market in a way that changes the effectiveness of such device. This communication reflects our analysts’ opinions as of the date of this communication and will not necessarily be updated as views or information change. All opinions expressed herein are subject to change without notice. NDR, or its affiliated companies, or their respective shareholders, directors, officers and/or employees, may have long or short positions in the securities discussed herein and may purchase or sell such securities without notice.