
Chart of the Week
NDR: Foreign Investors Return Strongly to U.S. Securities in May
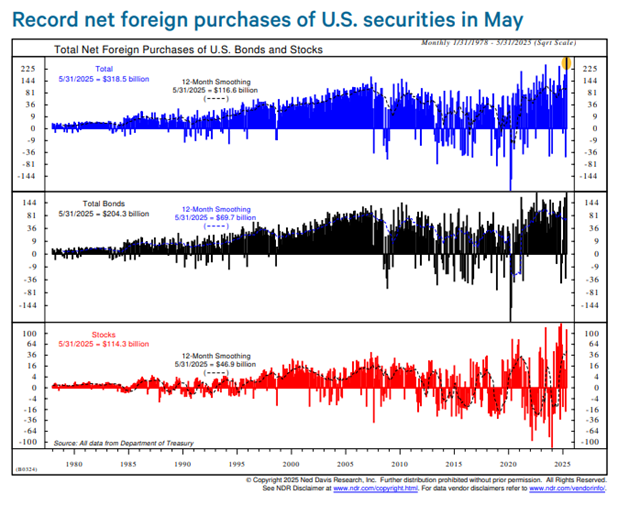
After stepping back in April, foreign investors returned to U.S. markets in force in May, with net purchases of long-term U.S. securities hitting a record $318.5 billion (chart above). Bond buying led the surge, reaching a record $204.3 billion, while equity purchases totaled $114.3 billion which was the fourth highest on record. Treasury securities saw the second-largest inflow on record at $146.3 billion, with 79% of that coming from the private sector. Purchases of agency and corporate bonds also rebounded, though they didn’t reach record highs. The buying was widespread across regions, with even China purchasing $12.4 billion.
Meanwhile, U.S. investors returned to foreign markets, buying a net $59.1 billion in overseas securities that mostly consisted of equities. After offsetting U.S. outflows, the net foreign inflow stood at $259.4 billion, with $195.9 billion in bonds and $63.5 billion in stocks. Bank liabilities rose by $41.1 billion, and short-term securities purchases added $10.3 billion. Total net international capital flows reached $311.1 billion, the third highest on record.
Want deeper insights and data to inform your strategy? Sign up for a complimentary trial of the NDR platform and explore our full range of research tools by completing the form to the right. Delve deeper into the dynamics shaping the economic landscape and offer actionable strategies for investors. Let us help you, See the Signals.™ To subscribe to the NDR Blog click here.
Ned Davis Research, Inc. (NDR), or any affiliates or employees, or any third-party data provider, shall not have any liability for any loss sustained by anyone who has relied on the information contained in any NDR publication. The data and analysis contained herein are provided “as is.” NDR disclaim any and all express or implied warranties, including, but not limited to, any warranties of merchantability, suitability or fitness for a particular purpose or use. Past recommendations and model results are not a guarantee of future results. Using any graph, chart, formula or other device to assist in deciding which securities to trade or when to trade them presents many difficulties and their effectiveness has significant limitations, including that prior patterns may not repeat themselves continuously or on any particular occasion. In addition, market participants using such devices can impact the market in a way that changes the effectiveness of such device. This communication reflects our analysts’ opinions as of the date of this communication and will not necessarily be updated as views or information change. All opinions expressed herein are subject to change without notice. NDR, or its affiliated companies, or their respective shareholders, directors, officers and/or employees, may have long or short positions in the securities discussed herein and may purchase or sell such securities without notice.